Your first coverage map
This guide walks through a complete run in the simulator. We’ll answer a hiker’s question — “what can I see from this summit?” — with a line-of-sight (LOS) viewshed. The same steps cover radio coverage, antenna siting and more; switching to RF is a one-click change noted along the way.
1. Open the simulator
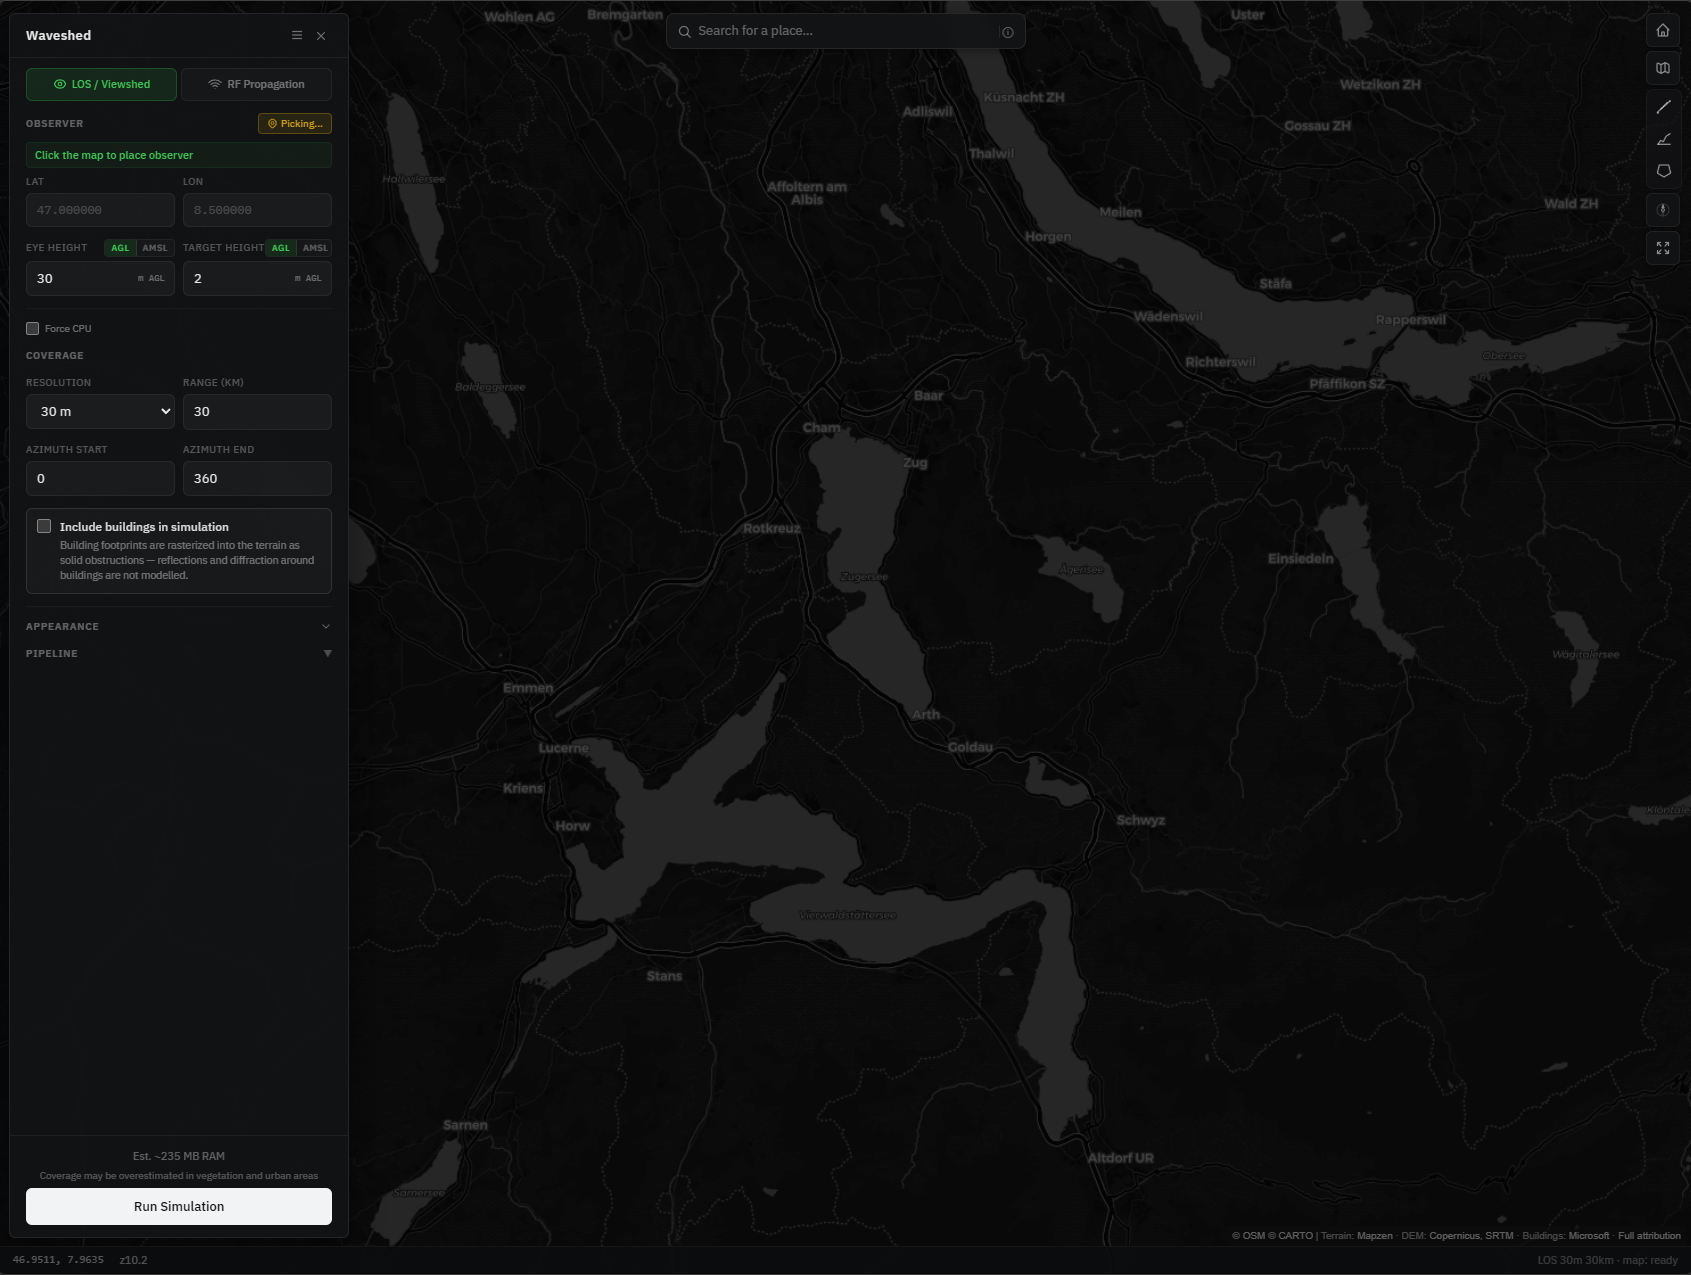
Go to the simulator — no account needed. The control panel sits on the left (a bottom sheet on mobile) and the map fills the rest. Along the bottom is a status bar showing the cursor’s coordinates, elevation and live progress; the map controls (home, panel toggle, basemap style) are top-right. Everything runs right here in your browser.
2. Choose the analysis: LOS
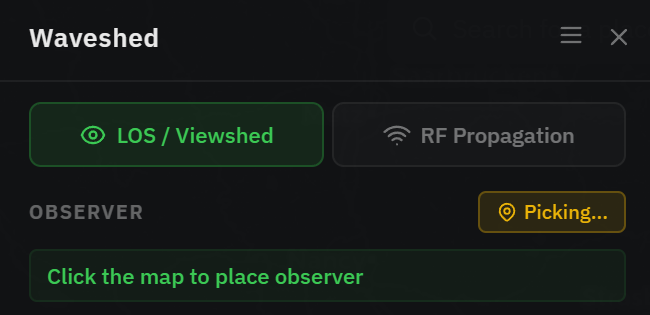
At the top of the panel are two buttons: LOS / Viewshed and RF Propagation. For “what can I see from here”, keep LOS / Viewshed selected — it highlights everything geometrically visible from your point. (The two are mutually exclusive: you run one mode at a time, and the panel’s labels change to match the mode you pick.)
3. Place the observer
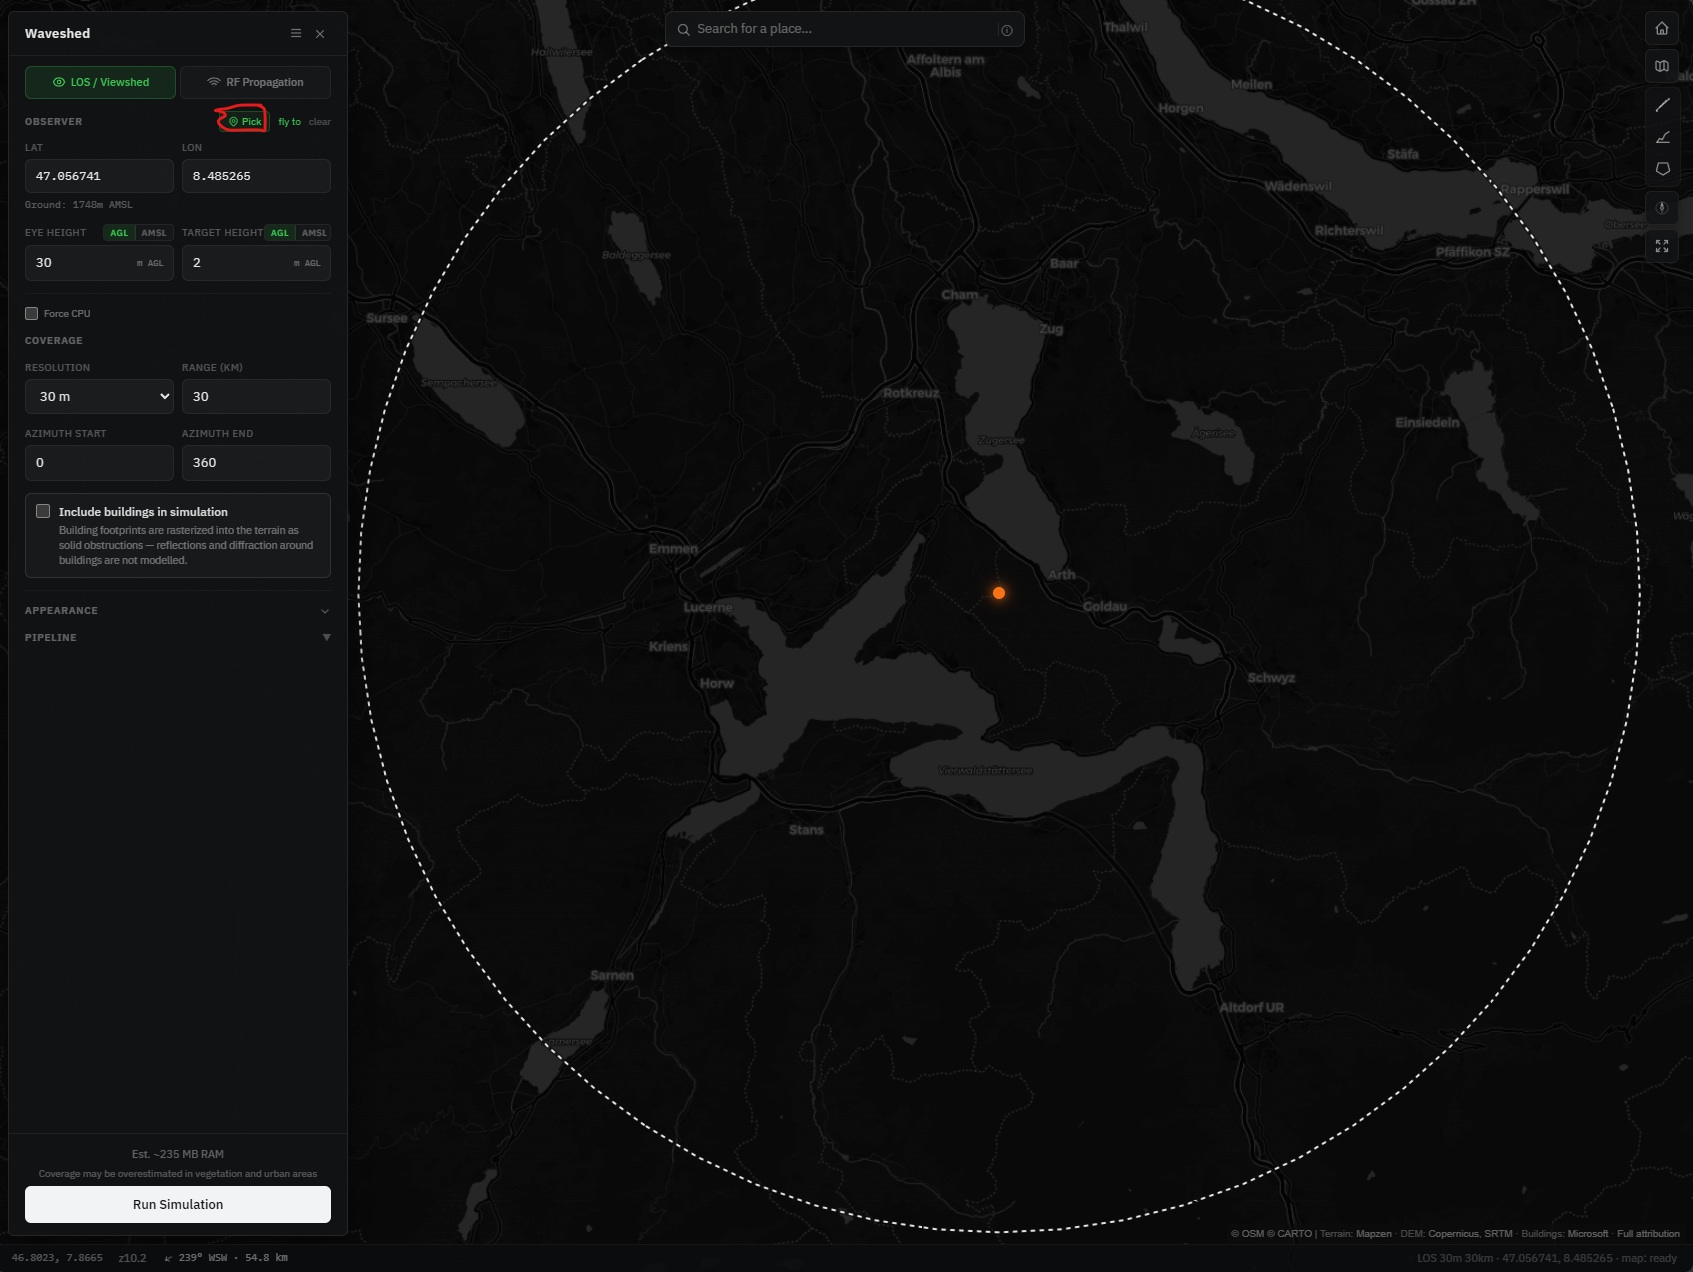
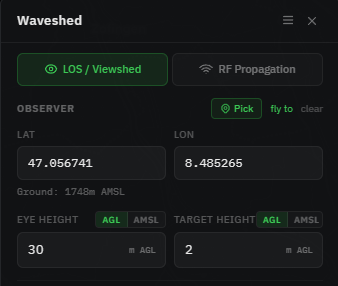
In the Observer section, click Pick then click the map — or just click the map directly, or type a place into the search box and jump to it. For our example, drop the observer on the summit you’re standing on. You can also type exact LAT/LON, and once a point is placed the panel shows the ground elevation there, plus fly to / clear shortcuts.
4. Set the heights
Set Eye height — how high your eyes are above the ground (≈1.7 m for a standing person) — and Target height — how tall the thing you’re trying to see is (another hiker ≈2 m, a hut, a summit cairn, an antenna). Each has an AGL (above ground level) / AMSL (above sea level) toggle; AGL is usually what you want for “what can I see”.
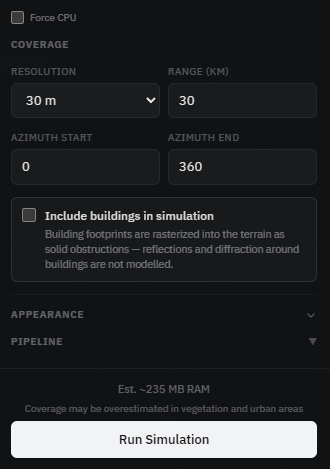
5. Set range and resolution, then run
In the Coverage section, set Range (km) — how far out to compute — and Resolution — the grid spacing (finer means more detail but more compute). You can optionally narrow the Azimuth to a sector instead of the full 360°. Then press Run Simulation in the panel footer; it turns into Cancel while it works. Runs currently go up to 30 km at 30 m (higher limits coming soon).
While it runs, the Pipeline panel fills a row of progress bars — Download → Compute → Render (plus Assembly if you included buildings) — turning green as each phase finishes, and the bottom status bar shows live progress.
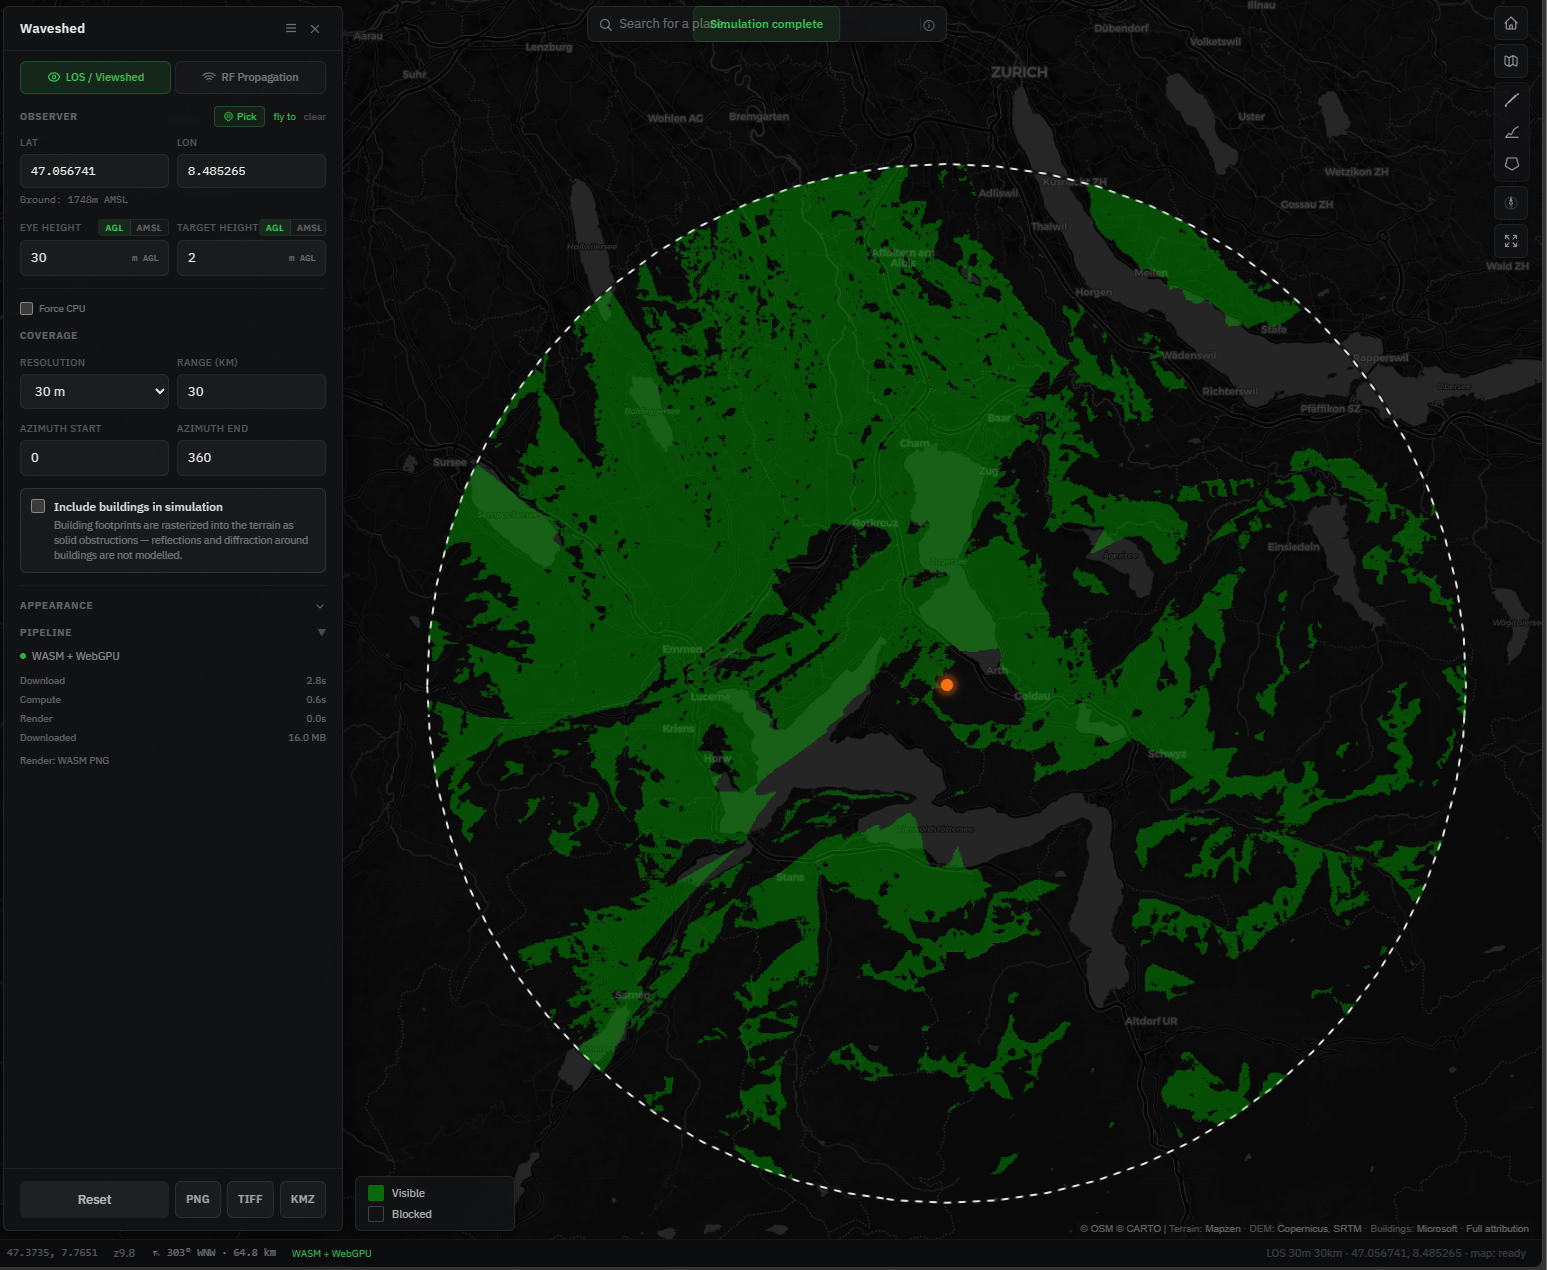
6. Read the result
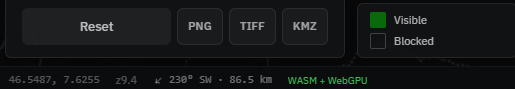
The shaded overlay is your answer: in LOS it’s the viewshed — everything visible from the observer (in RF it’s coverage, coloured by signal strength). Move the mouse over the map and the status bar reads out the bearing and distance from the observer to the cursor — handy for “is that peak in view, and how far?”. Export the result as PNG, TIFF (GeoTIFF for QGIS) or KMZ (Google Earth), or press Reset to start over.
Tips
- Raise the eye height (or pick a higher vantage point) to see how much more comes into view — useful for choosing a viewpoint or a mast.
- For hiking, compare two summits by running each as the observer and seeing which “sees” more terrain.
- Start at a coarse resolution for a fast answer, then refine the area that matters.
- Results are a planning estimate: terrain comes from ~30 m elevation data, and local trees and buildings aren’t fully captured.